Every week, the same ritual. Hours spent juggling dozens of tabs, copy-pasting data from a multitude of platforms and praying the Excel formulas hold. For many SMEs, reporting is a necessary evil, a time sink that produces reports already out of date by the time they are sent. But what if that lost time could be turned into a strategic advantage?
This article explores the transformation of reporting: the shift from a manual, time-consuming, error-prone process to an automated, reliable, real-time system that radically changes decision-making.
Part 1: Before – the manual reporting nightmare
To grasp the scale of the revolution, you first need to remember the starting point. Manual reporting is a fragmented, fragile process, a real house of cards that threatens to collapse at the slightest error.
1. The data obstacle course
The typical weekly process looks like a digital obstacle course:
- Manual collection:The marathon starts with exporting CSV or Excel files from a myriad of sources: CRM (Salesforce, HubSpot), analytics (Google Analytics), ad platforms (Google Ads, Meta Ads), accounting software (QuickBooks, Sage) and e-commerce platforms (Shopify, WooCommerce).
- Spreadsheet compilation:All this disparate data is then compiled into a giant spreadsheet. It is a tedious step that can take3 to 4 hours, full of copy-pasting and attempts at standardisation.
- Calculations and errors:Next comes the manual calculation of key performance indicators (KPIs). A simple formula error, a wrongly referenced cell, and the whole report becomes wrong. The error rate, often estimated at between10 and 15%, is a permanent sword of Damocles.
- Formatting and sending:After the calculations,1 to 2 hoursmore are spent creating static charts. The end result? A PDF file, emailed to stakeholders.
- Explanation meetings:Because the report is a frozen snapshot, it often requires a2-hourmeeting to explain the figures, answer questions and try to guess the trends.
2. The drawbacks of a system at the end of its rope
This archaic process is not just inefficient; it actively harms the business.
- Time lost: With6 to 8 hours spent every week, almost a full working day is sacrificed. Over a year, that is more than 360 hours that could have been devoted to strategic analysis, campaign optimisation or innovation.
- Out-of-date data: The final report presents data that is already3 to 7 days old. Decisions are therefore made by looking in the rear-view mirror, a dangerous practice in a fast-moving market.
- Lack of reliability: An error rate of 10 to 15% erodes trust in the data. Teams spend more time debating the validity of the figures than deciding what action to take. Automation, on the other hand, drastically reduces these human errors.
- Limited accessibility: A static PDF is a prison for data. It is impossible to drill into a figure, filter by channel or change a date range. Analytical curiosity is nipped in the bud.
- Zero responsiveness: If an ad campaign performs badly or a bug affects sales, you have to wait for the next weekly report to find out. Reaction time is disastrous, and losses pile up.
Part 2: After – the era of automation and smart dashboards
Automation, orchestrated by the right tools, does not just improve the existing process: it completely reinvents it. It turns reporting from a backward-looking chore into a proactive, intelligent central nervous system for the business.
1. A unified, automated data flow
The new process is smooth and integrated:
- Automatic collection:API connectors plug directly into all data sources (CRM, ads, etc.) and synchronise the information in real time or at a set frequency (every hour, every day).
- Centralisation:Data is consolidated, cleaned and transformed automatically in a central database (such as Airtable, PostgreSQL or even a structured Google Sheet). No more disparate formats and missing data.
- Reliable calculations:KPIs are calculated automatically and continuously. The logic is defined once, guaranteeing consistent results and an error rate below 1%.
2. Relevant KPIs for every department
Automation lets you track a wealth of indicators with no extra effort, giving a 360° view of performance.
- Sales:Real-time pipeline tracking (leads, MQLs, SQLs), conversion rate by stage, pipeline value, sales forecasts and deal velocity.
- Marketing :Campaign ROI analysis, cost per lead, engagement rate and landing page conversion rate to optimise spending continuously.
- Finance:A clear view of revenue (daily, weekly, monthly), MRR/ARR, gross margin, cash flow and burn rate for precise financial management.
- Customer support:Measuring the number of tickets, average response time, first-contact resolution rate and CSAT to ensure optimal customer satisfaction.
- E-commerce:Monitoring orders, average basket, cart abandonment rate and stock levels to react instantly to market trends.
3. Dynamic visualisation and smart distribution
The way information is delivered is just as transformed. The static PDF gives way to an ecosystem of dynamic visualisation and alerting.
- Live dashboards:Tools such as Google Data Studio, Tableau or Metabase offer dashboards accessible 24/7 on any device. Users can interact with the data, apply filters (period, channel, product) and explore the information in depth.
- Scheduled reports:Sending reports is still relevant, but it is now automated. A daily summary at 7 am, a full weekly report on Monday at 9 am, and a monthly review enriched with AI recommendations on the 1st of the month.
- Smart alerts:This is the most radical change. The system actively monitors KPIs and sends immediate alerts via Slack or email when there is an anomaly: a 20% drop in revenue, a collapsing conversion rate, payment times shooting up, etc. The company moves from a reactive mode to a proactive one.
Part 3: Measured results and a stratospheric ROI
Setting up an automated reporting system is not just a technical improvement; it is an investment with a fast, massive return on investment (ROI), affecting both operational efficiency and financial performance.
1. Before / after comparison: a radical transformation
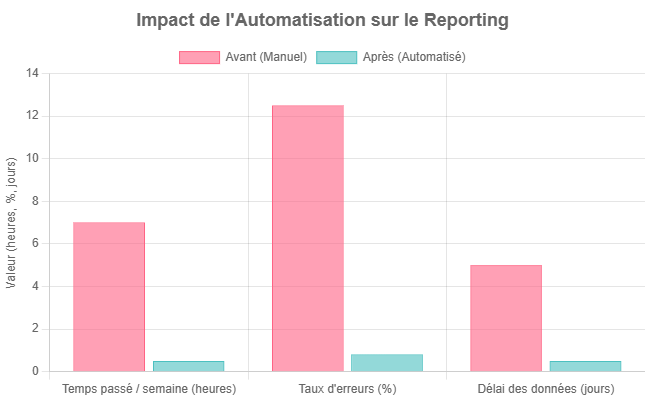
2. Quantifiable, strategic gains
- Time saved:Saving6 to 8 hours a weekamounts to around364 hours a year. Putting a value on this time gives a direct saving of around€4,550 a year, not counting the added value of the new strategic tasks accomplished.
- Performance gains:Responsiveness increases by more than 40%. Decisions are made on fresh, reliable data, which increases trust and transparency. According to some studies, optimising document workflows can make bringing new services to market four times faster.
3. Concrete examples of impact
The figures speak for themselves, but the stories speak even louder:
- Detecting a critical bug:An alert on a sudden drop in revenue made it possible to detect a bug on the payment page at 10 am. The problem was fixed before noon, avoiding a whole day of lost sales.
- Advertising optimisation:A Google Ads campaign with a negative ROI was identified on D+2 thanks to the marketing dashboard. It was paused immediately, saving more than €5,000 in wasted ad spend.
- Improved conversion:Analysing a rise in the cart abandonment rate revealed that delivery charges were seen as too high. Adjusting the delivery strategy increased the overall conversion rate by 12% in one month.
4. An ROI that speaks for itself
Combining the time savings with the gains from faster, smarter decisions, the return on investment is spectacular.
Estimated overall ROI: 200–300% in the first year.
This figure combines the time savings (€4,550/year), revenue protected thanks to fast problem resolution (€10k–30k/year), and opportunity gains from better allocation of resources.
Conclusion: stop managing reports and start steering your business
Moving to automated reporting is much more than a simple technology update. It is a paradigm shift that transforms a company’s culture, making it more agile, transparent and data-driven. By freeing your teams from low-value manual tasks, you give them the means to focus on what really matters: analysis, strategy and growth.
Today, powerful and accessible tools make this transformation possible for SMEs, not just for large groups. The question is no longer “whether” you should automate your reporting, but “when” you will start reaping the benefits of decision-making informed by real-time data.
FAQ
How many hours a week does an SME lose with manual Excel reporting?
On average, 6 to 8 hours a week are spent on manual reporting: collecting exports, compiling them in a spreadsheet, calculating KPIs, formatting and sending. Over a year, that represents more than 360 hours, almost a working day sacrificed every week. On top of that come the errors: the error rate on manual processes can reach 10 to 15%, which erodes trust in the data and generates extra meetings to check the figures. Automated reporting reduces this time to a few minutes of initial configuration.What is the ROI of an automated reporting system for an SME?
The return on investment is threefold: time savings (around €4,550/year, valuing the 6 to 8 hours recovered each week), revenue protected thanks to fast anomaly detection (an alert on a drop in revenue can prevent a whole day of lost sales), and opportunity gains from better decisions based on fresh data. The estimated overall ROI is 200 to 300% in the first year. It is no longer an IT investment; it is an investment in competitiveness.Which data sources can be connected to an automated dashboard?
Practically all your operational sources: CRM (Salesforce, HubSpot, Pipedrive), analytics (Google Analytics), ad platforms (Google Ads, Meta Ads), accounting software (QuickBooks, Sage, Pennylane), e-commerce platforms (Shopify, WooCommerce) and project management tools. API connectors synchronise the data in real time or at a set frequency. Each department (sales, marketing, finance, support, e-commerce) can access its own KPIs without waiting for the weekly report.How do smart alerts change decision-making in an SME?
It is the most radical change brought by reporting automation. Instead of waiting for the weekly report to discover that a campaign is performing badly or that a bug is affecting sales, the system actively monitors KPIs and triggers an immediate alert as soon as a threshold is crossed (via Slack or email, for example). A concrete example: an alert on a sudden drop in revenue made it possible to detect a bug on a payment page at 10 am. Fixed before noon, the problem only cost a few hours of sales instead of a whole day. The company moves from a reactive mode to a proactive one.Do you need technical skills to set up automated reporting in an SME?
No, modern reporting tools are accessible without development skills. Initial configuration of the connectors and definition of the KPIs require one to two weeks of support, after which the system runs on its own. The real skill required is not technical: it is knowing which indicators to steer by — a business question, not an IT one.Want to know where to start?
Invaist audits your processes, identifies the quick wins and deploys your first automated workflow. No IT team. No disruption to your organisation. In under 3 weeks. No commitment · Reply within 24h
Book a free diagnosisOur related solutions